
Htairut Sinpatanasakul
Nichada Tanchaya
1. The FX Ecosystem Strategy
Amidst the push for the use of local currencies in trade between Asian countries, doubts have been raised about whether it will actually reduce the exchange rate volatility or not. In 2021, the Bank of Thailand organized a media briefing introducing the new “FX ecosystem”. This strategy aims to reduce risk and mitigate fluctuations within the private financial sector.
The BoT’s plan involves 1) Encouraging the usage of local currencies for trade within countries as opposed to using USD, which the BoT claims to be more volatile than the currencies of our Asian neighbors. 2) Greater flexibility in transferring funds outside of Thailand entails allowing the transfer of larger funds, from 50,000 USD to 200,000 USD. The BoT also plans to increase the limit for investment in securities for small investors from 5 million USD to 10 million USD. Despite this increase in fund limits, risk is mitigated by the usage of notional pooling to calculate interest before any actual fund transfer. 3) Finally, the BoT aims to expand the scope of the Non-Resident Qualified Company (NRQC) program to permit foreign companies engaged in transactions with Thai firms to participate in local projects. Moreover, foreign investors will be permitted to invest directly in Thai financial institutions, instead of being restricted to using foreign financial institutions as intermediaries (BoT).
The BoT theorizes that USD is significantly more volatile than the currencies of fellow ASEAN countries and major East Asian investors, Japan and China. BoT predicted currencies such as MYR, IDR, JPY, and CNY to be less volatile as USD currency trends are seen to be constantly fluctuating (Bank of Thailand). However, at times, USD volatility may not be drastically different from local currencies.
2. Data Analysis
Analyzing the currency exchange rate from all countries in ASEAN: Thailand, Philippines, Myanmar, Vietnam, Indonesia, Brunei, Laos, Cambodia, Malaysia, and Singapore. As well as the United States of America will help determine whether the BoT’s claim is valid or not. All of the currencies are converted to THB to ensure consistency for all exchange rates. The time period we looked at was from 2003 to 2022 – though we would inevitably narrow this time frame down when calculating the volatility.
Table 1: *Average exchange rate of USD, MYR, SGD, PHP, IDR, MMK, KHR, LAK, VND, and BND to THB per day and the returns from each day
*All data provided by the Bank of Thailand
| Unit | USD/THB | Returns | MYR/THB | Returns | SGD/THB | Returns | PHP/THB | Returns | 1000 IDR/THB | Returns | MMK/THB | Returns | KHR/THB | Returns | LAK/THB | Returns | VND/THB | Returns | BND/THB | Returns |
| 06/27/2003 | 41.771 | 10.968 | 23.745 | 0.776 | 5.026 | 6.72 | 0.011 | 0.006 | 0.003 | 23.721 | ||||||||||
| 06/30/2003 | 42.047 | 0.6607454933 | 11.055 | 0.7932166302 | 23.881 | 0.5727521583 | 0.785 | 1.159793814 | 5.068 | 0.8356545961 | 6.769 | 0.7291666667 | 0.011 | 0 | 0.006 | 0 | 0.003 | 0 | 23.864 | 0.6028413642 |
| 07/02/2003 | 41.949 | -0.2330725141 | 11.028 | -0.2442333786 | 23.835 | -0.1926217495 | 0.785 | 0 | 5.093 | 0.4932912391 | 6.757 | -0.1772787709 | 0.011 | 0 | 0.006 | 0 | 0.003 | 0 | 23.796 | -0.2849480389 |
| 07/03/2003 | 41.782 | -0.3981024577 | 10.996 | -0.2901704752 | 23.829 | -0.02517306482 | 0.783 | -0.2547770701 | 5.092 | -0.01963479285 | 6.735 | -0.3255882788 | 0.011 | 0 | 0.006 | 0 | 0.003 | 0 | 23.796 | 0 |
| 07/04/2003 | 41.668 | -0.2728447657 | 10.956 | -0.3637686431 | 23.751 | -0.3273322422 | 0.78 | -0.3831417625 | 5.074 | -0.3534956795 | 6.712 | -0.3414996288 | 0.011 | 0 | 0.006 | 0 | 0.003 | 0 | 23.713 | -0.3487981173 |
| 07/07/2003 | 41.604 | -0.153595085 | 10.934 | -0.2008032129 | 23.778 | 0.113679424 | 0.779 | -0.1282051282 | 5.097 | 0.4532912889 | 6.701 | -0.1638855781 | 0.011 | 0 | 0.006 | 0 | 0.003 | 0 | 23.729 | 0.06747353772 |
| 07/08/2003 | 41.651 | 0.1129699067 | 10.945 | 0.1006036217 | 23.685 | -0.39111784 | 0.779 | 0 | 5.079 | -0.3531489111 | 6.707 | 0.08953887479 | 0.011 | 0 | 0.006 | 0 | 0.003 | 0 | 23.664 | -0.2739264191 |
| 07/09/2003 | 41.684 | 0.0792297904 | 10.959 | 0.1279122887 | 23.713 | 0.1182182816 | 0.779 | 0 | 5.071 | -0.1575113211 | 6.713 | 0.08945877441 | 0.011 | 0 | 0.006 | 0 | 0.003 | 0 | 23.69 | 0.1098715348 |
From this, the volatility can be calculated by finding the standard deviation of the returns. The SD of currency returns for each year over the span of 9 years (from 2013-2022) was calculated to gain perspective on volatility rates over different time periods as they may vary due to the severity of influencing events in that year. The table below presents the SD (volatility) of each currency for each year and is organized from lowest to highest volatility.
Table 2: Currency volatility of each year – 2013 to 2017 (USD, MYR, SGD, PHP, IDR, MMK, KHR, LAK, VND, and BND to THB)
| Currency | 2013 | Currency | 2014 | Currency | 2015 | Currency | 2016 | Currency | 2017 |
| LAK/THB | 0 | KHR/THB | 0 | VND/THB | 0 | VND/THB | 0 | LAK/THB | 0 |
| SGD/THB | 0.3233783 | LAK/THB | 0 | PHP/THB | 0.2655226047 | PHP/THB | 0.2789152081 | SGD/THB | 0.1668535312 |
| BND/THB | 0.3368730 | VND/THB | 0 | SGD/THB | 0.2871371771 | SGD/THB | 0.2874630664 | USD/THB | 0.2128634146 |
| PHP/THB | 0.3733422 | SGD/THB | 0.2088794097 | USD/THB | 0.3000352127 | USD/THB | 0.2941079377 | MYR/THB | 0.2158418973 |
| USD/THB | 0.3853640 | BND/THB | 0.2175276136 | BND/THB | 0.3022459032 | BND/THB | 0.3085203105 | PHP/THB | 0.2599534338 |
| MYR/THB | 0.4270684 | USD/THB | 0.2470763649 | IDR/THB | 0.5440227133 | IDR/THB | 0.4837139314 | BND/THB | 0.2767837282 |
| MMK/THB | 1.0185583 | PHP/THB | 0.2804119151 | MYR/THB | 0.58372783 | MYR/THB | 0.5340322857 | IDR/THB | 0.3131753799 |
| IDR/THB | 1.1283543 | MYR/THB | 0.2926429874 | MMK/THB | 0.9737168 | MMK/THB | 1.038710306 | KHR/THB | 1.340881047 |
| KHR/THB | 1.7220561 | IDR/THB | 0.4343306205 | KHR/THB | 1.718522144 | KHR/THB | 1.070657291 | MMK/THB | 1.415681943 |
| VND/THB | 10.13469297 | MMK/THB | 0.9326468882 | LAK/THB | 5.039634767 | LAK/THB | 2.898269578 | VND/THB | 11.07782713 |
Table 3: Currency volatility of each year – 2017 to 2022 (USD, MYR, SGD, PHP, IDR, MMK, KHR, LAK, VND, and BND to THB)
| Currency | 2018 | Currency | 2019 | Currency | 2020 | Currency | 2021 | Currency | 2022 |
| SGD/THB | 0.2377116076 | VND/THB | 0 | VND/THB | 0 | VND/THB | 0 | BND/THB | 0.3339934768 |
| USD/THB | 0.2842264375 | BND/THB | 0.2143627469 | SGD/THB | 0.2769638608 | LAK/THB | 0 | SGD/THB | 0.3375329665 |
| PHP/THB | 0.2918621881 | SGD/THB | 0.2147690021 | BND/THB | 0.2929832529 | BND/THB | 0.2714539924 | MYR/THB | 0.4298866562 |
| BND/THB | 0.2942829763 | USD/THB | 0.2548634467 | MYR/THB | 0.3361389096 | SGD/THB | 0.2735603205 | PHP/THB | 0.4510136656 |
| MYR/THB | 0.4289480335 | MYR/THB | 0.2752411468 | PHP/THB | 0.3496466395 | MYR/THB | 0.2868651719 | IDR/THB | 0.4547196764 |
| IDR/THB | 0.4298719217 | PHP/THB | 0.3239833779 | USD/THB | 0.3636986906 | USD/THB | 0.336152939 | USD/THB | 0.5099284095 |
| KHR/THB | 1.203829825 | IDR/THB | 0.3651645496 | IDR/THB | 0.5550524045 | IDR/THB | 0.3415797417 | MMK/THB | 1.641402126 |
| MMK/THB | 1.217312885 | MMK/THB | 1.124767384 | MMK/THB | 1.381065932 | PHP/THB | 0.3545686044 | LAK/THB | 2.147188755 |
| LAK/THB | 2.914737199 | LAK/THB | 1.597191412 | KHR/THB | 1.725610175 | KHR/THB | 0.920223752 | KHR/THB | 2.644138635 |
| VND/THB | 6.437394642 | KHR/THB | 2.251626599 | LAK/THB | 5.986697052 | MMK/THB | 1.554284914 | VND/THB | 12.48443014 |
As the years go by, it can be observed that USD’s volatility in comparison to the other currencies remains roughly in the middle in terms of ranking. In 2013, USD ranks as the 4th least volatile currency while it ranks 5th most volatile in 2022 – its volatility does not change frequently but as the years increase to the current year, 2022, volatility rates are seen to increase as USD continuously moves up the ranking since 2019. This may be attributed to the unpredictable occurrence of the global pandemic, COVID-19, as it left a significant impact on the economy worldwide, and with the US being one of the leading economies of the world, the impact may have been more severe. The US has also been hiking up their interest rates, and the ongoing trade war between China and the U.S. has harmed around 18% of the USA’s imports (3.6% of GDP) (CEPR).
Meanwhile, ASEAN countries drastically fluctuate in terms of their relative volatility over the course of the last 2 decades, making them considerably more unreliable to convert between. For example, VND placed as the most volatile 4x and the least volatile 6x over the course of the 20-year period. LAK also starts off being one of the least volatile currencies and lands as 3rd most volatile in 2022. However, while VND and LAK are extremely volatile, currencies such as SGD and BND are less volatile and have volatility rates that are mostly consistent throughout the 10-year time frame.
Graph 1: Currency volatility of each year – 2013 to 2022 (USD, MYR, SGD, PHP, IDR, MMK, KHR, LAK, VND, and BND to THB)
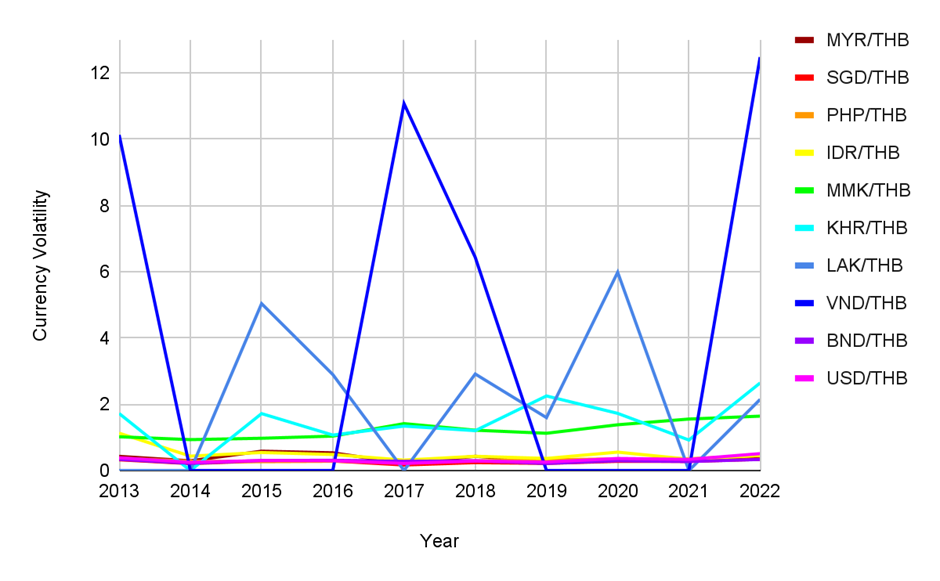
This graph illustrates the data from ‘Table 2’ in graph form, so changes over the years are clearly indicated through trendlines. As mentioned earlier, VND and LAK are extremely volatile. It is evident that their volatility rates are not only extremely high, but fluctuations between each year are severe. In comparison to all 10 currencies, USD is one of the most stable in terms of volatility. While occasionally it may have higher volatility rates than other currencies, its actual volatility remains consistent; volatility rates of all years are within 0.21 – 0.39, excluding 2022. Although the volatility of USD in 2022 is at its peak, 0.5099, all volatility rates for every currency in 2022 is seen to have a drastic increase from the previous year. While in some years VND’s volatility rate is 0, in other years it exceeds 10, demonstrating a large range of fluctuation and establishing the currency’s volatility as extremely unpredictable.
3. Strategies going forward
The data gathered indicates that the FX Ecosystem may be misguided in its tactic to promote domestic currency exchange. THB to USD is one of the most stable in terms of volatility ranking compared to other Southeast Asian currencies. As volatility differs, with ASEAN currencies fluctuating drastically between years, the exchanging of domestic currency might only be applicable for short-term usage in certain years. Thus, authorities may want to reconsider whether to stray from using USD conversions or not.
However, this situation is not so clear cut – it may actually be in traders’ interest to switch to using local currencies. Although the data points to quite a few ASEAN currencies being more volatile than USD, this could change in the future based on whether traders shift to using local currencies or not. Currencies like VND, KHR, and MMK, will likely be more volatile because they haven’t been used in currency conversion in the past. Traditionally, USD has been considered the “global currency” and is the currency that appears most frequently in the Forex major currency pairs. Since it is traded often, its liquidity is high, which hypothetically establishes it as a low-volatility currency (Blueberry Markets).
Moving forward, if Thai investors begin to trade more often with ASEAN and other Asian currencies, these currencies will rise in liquidity and might be less volatile – perhaps even less volatile than the USD. This is a prospect that policy makers may want to investigate.
Another approach to mitigate exchange rate risk would be to improve on previously employed methods. As the volatility of exchange rate changes over the years, it would be impractical to keep changing the currencies that THB is converted to. Not to mention, difficult and tedious to predict based on the plethora of factors involved.
In the meantime, policy makers could focus on how to best handle the inevitable risk traders must face. Authorities should aim to improve financial literacy, through organized programs and increased media literacy, so Thai traders can effectively respond and protect against the risks of a volatile exchange rate. Traders should be encouraged to use risk-diminishing tactics or hedging. Using natural hedges to invest in inverse risks and investing in multiple countries are both ways to protect yourself against your own currency depreciating. The exchange rate for one’s other investments may remain favorable and offset any losses you make. Furthermore, forward contracts should be used to set a fixed exchange rate prior to the time of buying/selling to avoid being confronted with an unexpected exchange rate in the future (American Express).
By improving Thai traders’ knowledge of the aforementioned ways to reduce exchange rate risk, we can negate the harmful effects of exchange rate volatility in a predictable way, rather than attempting to rely on the ever-changing volatility levels of Southeast Asian currencies.
Works Cited
American Express. “How to Manage Currency Volatility When Making International Payments.” Business Class: Trends and Insights | American Express, 12 Sept. 2019, www.americanexpress.com/en-gb/business/trends-and-insights/articles/how-to-manage-currency-volatility/ Accessed 21 July 2023.
Bank of Thailand. “ความคืบหน้าการผลักดัน FX Ecosystem ใหม่.” Www.bot.or.th, 27 June 2023, www.bot.or.th/th/news-and-media/news/news-20230627.html Accessed 21 July 2023.
Blueberry Markets. “Intermediate Trading – What Is Forex Liquidity and Volatility.” Blueberry Markets, https://blueberrymarkets.com/learn/forex-intermediate/#:~:text=Liquidity%20in%20Forex%20is%20the,is%20considered%20a%20liquid%20currency. Accessed 22 July 2023.
James Chen. “Currency Risk: Definition, Examples, and Ways to Manage.” Investopedia, 25 May 2022, www.investopedia.com/terms/c/currencyrisk.asp#:~:text=Meanwhile%2C%20investing%20globally%20is%20a Accessed 21 July 2023.
VOXEU. “The ‘Bystander Effect’ of the US-China Trade War.” CEPR, 10 June 2023, https://cepr.org/voxeu/columns/bystander-effect-us-china-trade-war#:~:text=US%20tariffs%20affected%20around%2018,the%20US%20(Figure%201) Accessed 21 July 2023.


Ms. Htairut Sinpatanasakul
Intern at Macroeconomic Policy Division
Fiscal Policy Office
ผู้เขียน

Ms. Nichada Tanchaya
Intern at Macroeconomic Policy Division
Fiscal Policy Office
ผู้เขียน